I’ve always reiterated that PowerBI is more than just a visualization tool. It goes beyond so so and so made the highest sales while so so and so made least etc. One type of analysis you can do with PowerBI is what is called scenario analysis.
We’ve all had this had i known moment. If you had known, you would have done something differently. What if I had done this thing this way or that way, maybe the result would have been different. That is basically you creating scenarios in your head.
A similar thing can be done with data. What if we put some discount on a product and demand increases by a certain percentage, what is going to be the effect on the profit etc. This kind of analysis is simply called scenario analysis.
The Corporate Finance Institute defined Scenario analysis as a process of examining and evaluating possible events or scenarios that could take place in the future and predicting the various feasible results or possible outcomes.
How then do we achieve this?
Similar to the excel what-if parameter, PowerBI has its own what-if parameter and this is what is used to create several scenarios.
Our data model is a simple and straight-forward one you are used to

A preview of the customer table

A preview of the location table

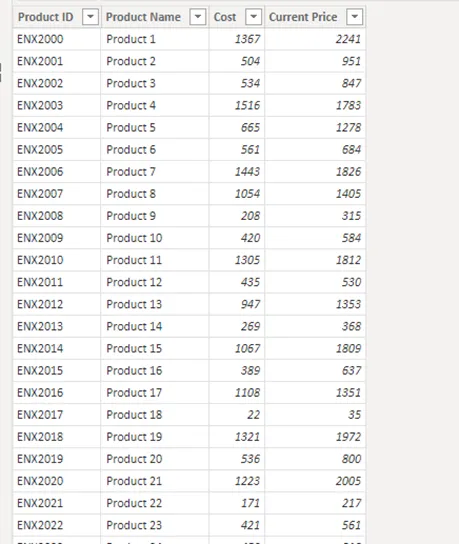
A preview of the product table

A preview of the sales table

As you can see, it’s a straightforward model. Nothing complicated. Now we create our Total sales, total cost, and total profits measures. Remember I said to carry out scenario analysis, you need to use iterative functions. So, we would be using the SUMX function.


We’ve gotten our base measures ready. These are the measures that will be modified for our scenario.
Let’s create our scenarios using the what-if parameter. Under the modeling tab, select new parameter

A pop up like this then comes up

We will first create our discount parameter. So, fill in the pop-up as seen in the screenshot.

What this does is create a table and a related measure and populate it with a range starting from 0 to 0.5. simply put as 0–50% with an increment of 1.
Ensure the Add Slicer to this page is ticked and then select Ok.
Go to your data view, you’ll find a new table that looks like the image below with an associated measure called Discount value.

Convert this column to a percentage.

Now we do the same for demand because as we give discounts on products, we expect demand to increase. Note that demand speaks to the number of goods purchased.

Change the data type to a percentage as we did for discounts.
Now we have our scenario parameters ready.
In your report view, you should have two sliders like this.

Now we modify our DAX measure to accommodate the parameters

The next step is to create a line chart and then drag your total sales and scenario sales onto it with your mouse. Notice that as you move the slider, the scenario sales keep on changing i.e., as you are creating scenarios based on existing data, you are seeing the potential outcomes for the future.

And that my friend, is how you carry out a scenario analysis.
You can view the completed work I did on it here
If you can create something similar, that’s even better. Now you can see that even with a simple data model and simple Dax. You can do amazing things with PowerBI.
Comments